- [Early Response]: Eastern Orthodoxy as a Proportion of the Population
- [Early Response]: Eastern Orthodox in Greater Brisbane
- Growth and Decline in Self-Identification to Christian Groups
- Overseas-Born Adherents
- Jurisdiction Sizes
- Jurisdiction Proportions
- Growth Rates, Controlled for New Migration
- Ethnic Intermarriages
- Churches by Ethnic Identification
- Growth and Decline of Christian Theologies in Australia
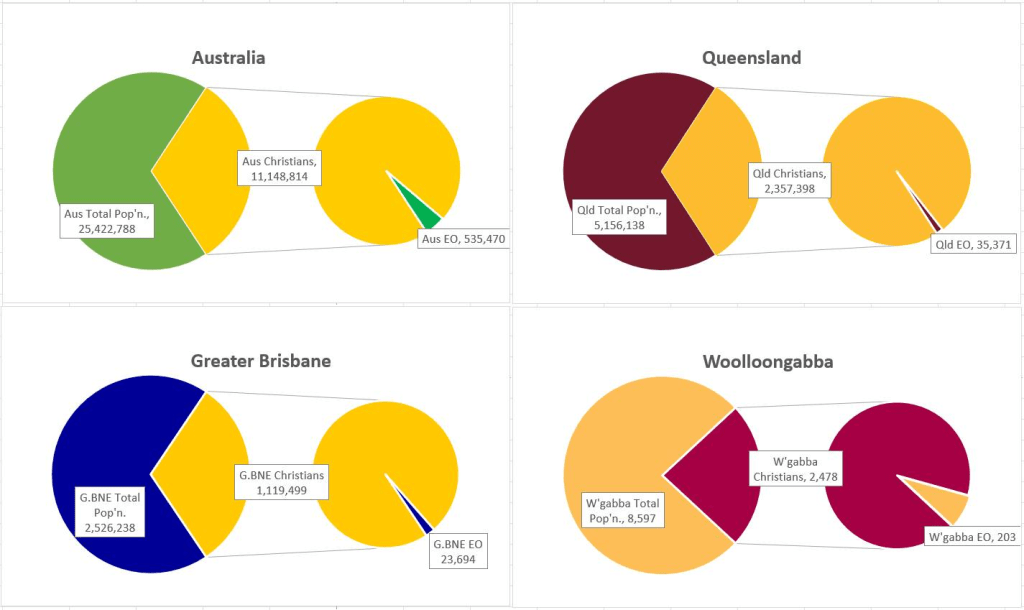
Left circle: total population, with proportion who self-identify as Christians;
Right circle: self-identified Christian population, with proportion who self-identify as E.O.]
Eastern Orthodoxy as a Proportion of the Population
Written by Fr Andrew Smith
Originally published on 29 June 2022:
https://www.facebook.com/photo/?fbid=5152337208221595&set=a.5189970227791626
Census 2021 for Eastern Orthodox – some early findings:
– AUSTRALIA: 535,470 Eastern Orthodox (down from 580k in 2016);
– QUEENSLAND: 35,371 Eastern Orthodox – fourth highest state (after SA on 42k).
– GREATER BRISBANE: 23,694 Eastern Orthodox.
By LGA:
– Brisbane City Council: 16.8k
– Logan City Council: 2.6k
– Moreton Bay Regional Council: 1.9k
– Redlands City Council: 1.2k
– Ipswich City Council: 0.8k
– Scenic Rim Regional Council: <100
– Lockyer Valley Regional Council: <100
Most of the remaining Eastern Orthodox in Queensland are: Gold Coast (6.2k), Townsville (1.1k), and Sunshine Coast (1k).
Caveats: it’s early days & a lot of relevant data hasn’t been released.
BUT, based on my review of data (census & otherwise), my current hypotheses:
[1] EO numerical decline is a combination of mortality rates among migrants and the general social trend towards ‘No Religion’.
We’d need ‘religion-to-age’ data to confirm this – but, if that’s the case, it’s an illustration of post-migration generations assimilating into the mainstream.
[2] EO decline is not as catastrophic as it seems.
We’re just shy of the raw numbers we had at 2006 (544k). The proportion was stable at 2.6%, but is now 2.1% – a significant decline, but not catastrophic, nor irreversible, nor in a vacuum.
[3] EO is still *very* much restricted to capitals and major urban centres.
Australia is highly urbanised, and EO moreso – reflected in the locations of our parishes. With some exceptions, we are very focused on EO participating in churches headed with a priest. We haven’t really figured out planting churches in advance of demand (eg for evangelism), nor facilitating regional/rural Orthodox to gather together and create local community.
[4] The Census is measuring a decline in self-identifying with a Christian faith.
That is, it’s not indicating a mass-apostasy, or declining prayers. Previously, Australians would select the denomination they were baptised in; now, Australians are selecting what their actual religion is. The Census is measuring a decline in nominalism – if there was a decline in religious observance, it happened long ago.
(I’m curious if this is part of the cultural difference between Millennials and Boomers).
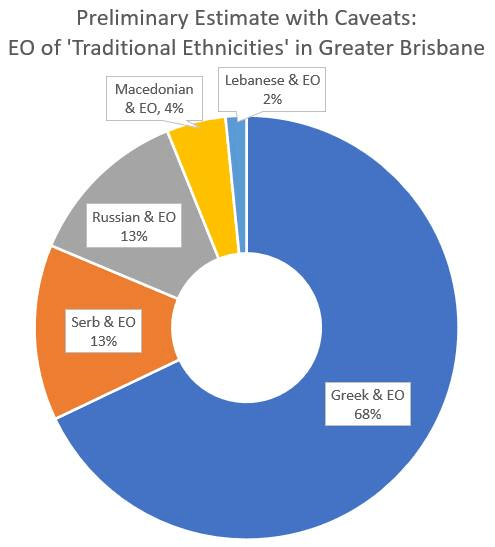
Eastern Orthodox in Greater Brisbane:
An Early and Provisional Estimate.
Written by Fr Andrew Smith
Originally published on 30 June 2022:
https://www.facebook.com/photo/?fbid=5154812011307448&set=a.5189970227791626
We still don’t know how large each EO jurisdiction is here.
But, claimed ancestry will take us most of the way there.
In Greater Brisbane:
– Greeks: 19,998. (2261 born in Greece).
– Russians: 10,223.
– Serbs: 6,495.
– Lebanese: 5,899. (1158 born in Lebanon).
– Macedonians: 1,993. (709 born in North Macedonia).
(NB: if I don’t have the number of ‘born in’, it means it wasn’t listed at the time of writing…)
But, for religious affiliation, we’re not quite there.
We don’t have 2021 data on the proportions of religion held by each claimed ancestry, so let’s apply 2016 data:
– Greeks: 90.6% EO = 18,118 EO of Greek ancestry
– Russians: 32.8% EO = 3,353 EO of Russian ancestry
– Serbs: 55.1% EO = 3,578 EO of Serbian ancestry
– Lebanese: 7.2% EO = 424 EO of Lebanese ancestry
– Macedonians: 60.4% EO = 1,203 EO of Macedonian ancestry
There are caveats, of course: it excludes smaller ancestries (Belorussian, Bulgarian, Cypriot, Palestinian, Romanian, Syrian, Ukrainian, et al), excludes conversions, double-counts mixed ancestries, and combines 2021 data with 2016 proportions.
As far as proportions go, however, it’s not a bad place to start.

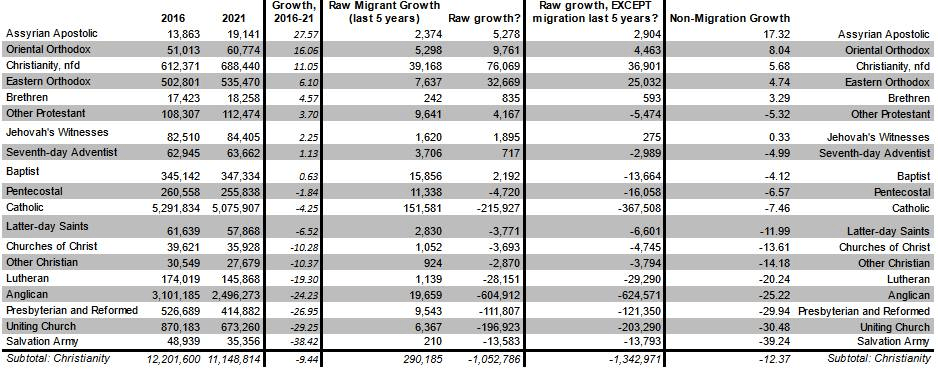
Growth and Decline in Self-Identification to Christian Groups
Written by Fr Andrew Smith
Originally published on 8 July 2022:
https://www.facebook.com/photo/?fbid=5176619882459994&set=a.5189970227791626
Census 2021: Growth and Decline in Self-Identification to Christian Groups. ![]()
Since I last posted on the census (see comments), more data has been released that is useful in understanding Eastern Orthodoxy in Australia. In today’s graph, we can see the growth and decline in self-identification with Christian groups – listed in order of their size in 2021.
For Eastern Orthodox, there’s a lot that can be said:
![]() FIRST:
FIRST: ![]()
![]() .
.
The raw numbers have EO growing (from 502k to 535k).
![]() SECOND:
SECOND: ![]()
![]() ;
; ![]()
![]() .
.
At 6.1%, the EO growth rate is solid. But compared to a decline of 9.4% in the broader Christian population, it’s downright surprising.
![]() THIRD: NOT SO FAST.
THIRD: NOT SO FAST.
Hold your horses – we’re growing slower than the Australian population is (7.95% bigger). These results do not justify any sense of triumph.
![]() LASTLY: WHAT IS THIS MEASURING?
LASTLY: WHAT IS THIS MEASURING?
Caveats abound: the nature of the Australian census is that a person has to be committed enough to tick a box to indicate a faith. It isn’t a measure of commitment beyond that (prayer, belief in a deity, church attendance).
While many Anglo-Australians are rejecting a nominal faith (NB: I’ll explain the data for this in a later post), it would be an assumption to say that this same dynamic is playing out with the migrant groups (and their descendants) that form the bulk of Eastern Orthodox in Australia today.

Overseas-Born Adherents
Written by Fr Andrew Smith
Originally published on 9 July 2022:
https://www.facebook.com/photo/?fbid=5179385058850143&set=a.5189970227791626
Australia has a self-identity as a ‘nation of immigrants’, and this includes our faiths. In today’s graph, we can see the percentage of adherents of each Christian group who were born overseas, listed in order of their size in 2021.
My Gleanings for Eastern Orthodox:![]() FIRST:
FIRST:
It’s true that many EO immigrated to Australia. It’s also true that, now, the majority of EO have been born in Australia. I think it is positive that our Church has generational roots in this country.
![]() SECOND:
SECOND:
We’re not wildly far away from the average for Christian groups generally (one-third vs one-quarter). For example, Baptists and Pentecostals have a similar percentage of overseas-born adherents, while other ‘Eastern denominations’ (so to speak) have far higher rates. (NB: I think this is neither good nor bad, just noteworthy).

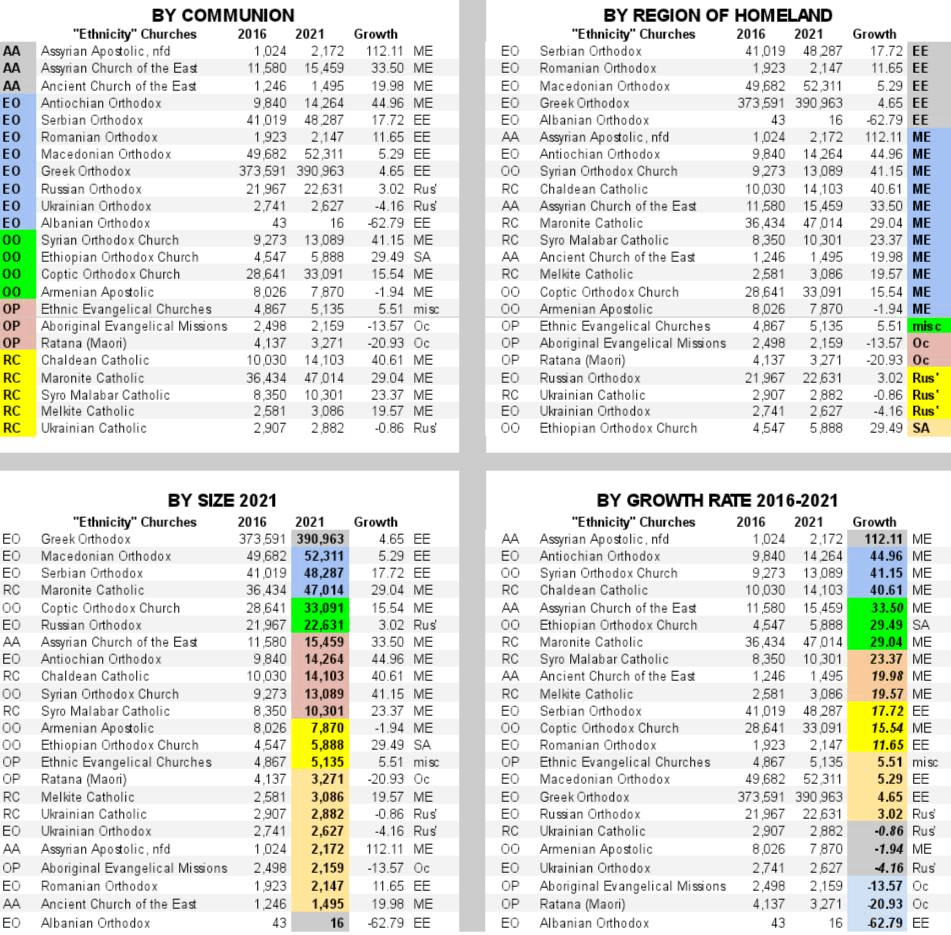
Jurisdiction Sizes
Written by Fr Andrew Smith
Originally published on 10 July 2022:
https://www.facebook.com/photo/?fbid=5181968875258428&set=a.5189970227791626
As we know, history means that Eastern Orthodoxy in Australia (and the Western world in general) is divided into jurisdictions. Below, I’ve compiled the respective size of each jurisdiction, along with each respective growth rate. (It’s taken a little work to get those two data points to work together, but hopefully the end result is good).
PREFACE: ABOUT THE DATA…![]() FIRST: “Lies, Lies and Statistics”.
FIRST: “Lies, Lies and Statistics”.
One statistic in isolation is worse than useless – because one statistic in isolation is open to overconfident misinterpretation.
Here, I pondered over how to present the ‘jurisdiction size’ dataset, and the ‘jurisdiction growth’ dataset, and concluded that they must be presented together so that each had context.
![]() SECOND: The Census Itself
SECOND: The Census Itself
In 2016, we had #CensusFail, and most submitted their form by paper – when you could tick ‘Greek Orthodox’ or write in your particular jurisdiction.
In 2021, most submitted online, and it was much easier to select one’s ‘subtype’ (within the broader category of Eastern Orthodox).
For comparing data from 2016 to 2021, it’s hard for me to say what impact this may have had.
ALSO: needless to say, a 2021 census won’t pick up things that happen in 2022. It’s a snapshot of this-time-last year.
![]() THIRD: Accuracy
THIRD: Accuracy
2021 is likely to be the most accurate number we’ve ever had to determine the jurisdiction size of nominal members.
NOW, FOR EASTERN ORTHODOX:
WHAT DOES THIS GROWTH EVEN MEAN?![]() A) Jurisdictional growth is mostly impactful within that jurisdiction. The Antiochian Orthodox growth rate of 45% is extraordinary by every standard, but it’s the result of 5k more people since 2016. The main impact of this is going to be felt within the Antiochian Archdiocese – new communities, new churches, new clergy, etc etc, rather than for Australian society in general. We can say likewise about the Albanian Orthodox – their 62.79% decline is curious, but it was caused by a drop from 42 to 16 over five years.
A) Jurisdictional growth is mostly impactful within that jurisdiction. The Antiochian Orthodox growth rate of 45% is extraordinary by every standard, but it’s the result of 5k more people since 2016. The main impact of this is going to be felt within the Antiochian Archdiocese – new communities, new churches, new clergy, etc etc, rather than for Australian society in general. We can say likewise about the Albanian Orthodox – their 62.79% decline is curious, but it was caused by a drop from 42 to 16 over five years.![]() B) We’re almost-universally growing, at a time when self-identifying with Christianity is shrinking.
B) We’re almost-universally growing, at a time when self-identifying with Christianity is shrinking.![]() C) We’re growing, but slower than the general population – so our proportion of the Australian population is actually shrinking.
C) We’re growing, but slower than the general population – so our proportion of the Australian population is actually shrinking.

Jurisdiction Proportions
Written by Fr Andrew Smith
Originally published on 11 July 2022:
https://www.facebook.com/photo?fbid=5183553365099979&set=a.5189970227791626
ICYMI: EO in Australia is in various jurisdictions.
Yesterday, I compiled the size and growth of each jurisdiction; today, the comparative size of jurisdictions. Due to proportions (and how to show them on a pie chart), I’ve created two: the first, Greek Orthodox and Other Orthodox; the second, the proportions of most jurisdictions within the Other Orthodox.
– First, the Greek Orthodox proportion of EO in Australia is very high – almost three quarters of EO in Australia identify as Greek Orthodox. (This is much more than the USA (our usual point of comparison).
– Then, the Macedonians and the Serbs, running almost neck-and-neck.
– Then, the Russians, followed by the Antiochians.
– Then a number of other smaller jurisdictions (Romanian, Ukrainian, et al).
THREE GLEANINGS FOR EO:
– The proportions here have changed since 2016: the Greek Orthodox grew by 4.6%, while the ‘All Other EO’ grew by 11.8%.
– Despite being a significantly lower percentage: there are more newly-affiliated Greek Orthodox than there are newly-affiliated ‘All Other Eastern Orthodox’ – the Census recorded 17.3k more Greek Orthodox, while All Other EO recorded 15.2k more (combined).
– The Greek Orthodox Archdiocese has about half of the parishes in Australia, but three-quarters of the population. If Krindatch’s work in the USA applies, this is most likely due to the simple fact that the GOA has larger parishes than most other jurisdictions.
Growth Rates, Controlled for New Migration
Written by Fr Andrew Smith
Originally published on 12 July 2022:
https://www.facebook.com/photo?fbid=5187070331414949&set=a.5189970227791626
There’s three basic ways that numbers in religious groups can grow: more births than deaths, more migrants incoming than outgoing, and more affiliations than disaffiliations.
With the data that I’ve seen as publicly available, we can’t control for all of those variables. However, we can control for those who are people who are (a) born overseas, who (b) arrived in the last 5 years.
This produces some really surprising changes. For example, some denominations have more adherents, but only because of migration (Baptists and Seventh Day Adventists).
Often, when looking at EO growth, the first response is ‘it’s because of migration’.
TLDR: we know it’s not.
On the contrary: when removing for migrants from the last five years, EO is the third largest growing Christian denomination.
Stats, when controlling for born-overseas migrants in the last five years:
1. Assyrian Apostolic: 26.7% growth changes to 17.3% growth;
2. OO: 16% growth changes to 8%;
3. EO, 6.1% growth changes to 4.7%;
4. Brethren, 4.5% growth changes to 3.3%.
SO, the takeaway:
[1] Eastern Orthodox growth might be because of birth rates being higher than mortality rates, and it might be because there are more people converting to Orthodoxy than leaving it, or some combination thereof.
[2] But, we can’t write our growth off as just because of higher migration.
[3] Something measurably interesting has happened, and #Census2021 caught it on paper.

Ethnic Intermarriages
Written by Fr Andrew Smith
Originally published on 13 July 2022:
https://www.facebook.com/photo?fbid=5189627777825871&set=a.5189970227791626
KEY TAKEAWAY: Eastern Orthodox are about as ‘ethnically intermarried’ as the general Australian population.
Data and Reasoning:
In the Census, we’re able to select multiple ancestries. In the data at hand, these are then grouped according to nine geographical areas – closer to what we formerly (and inaccurately) called ‘races’. (For example, ‘English’ and ‘Norwegian’ ancestries would both come under ‘North-West European’).
The chart tracks this level of diversity.
Each person has an ancestry of one kind or another.
For example, the Assyrian Apostolic have a rate very close to 1 – that is, almost every Assyrian Apostolic adherent has ‘North African and Middle Eastern’ ancestry.
In contrast, the Mormons (i.e. LDS) have a rate of 1.284 – one of the more mixed groups (mostly split between ‘Oceanian’ and North+West Europe).
So, the data comparisons for EO in Aus:
– The ‘averaged’ Australian hails from 1.143 global regions.
– The ‘averaged’ Christian is from 1.203 global regions – slightly more ‘mixed’ than the Australian population.
– The ‘averaged’ Eastern Orthodox hails from 1.138 global regions – effectively the same as the general Australian population.
AND,
BONUS POINT OF CURIOSITY:
Most religious groups still run along ancestral and cultural lines.
Some of these are obvious – the Oriental Orthodox have large numbers under North Africa + Middle East (Copts), ‘Southern and Central Asian’ (various Malankarans from India), and ‘Sub-Saharan Africa’ (Ethiopians & Eritreans).
It’s not surprising that most Eastern Orthodox claim ‘Eastern and Southern European’ ancestry (466k of 535k).
Yet, one quarter claim ancestry from another part of the world: mostly Oceania and North-West Europe.
– I’d hypothesise that Oceania (59k) is a product of EO in Australia self-identifying as ancestrally Australian (most likely a mark of ‘calling Australia home’).
– However, North+West Europe (40k) cannot be explained by an identified ancestral Orthodox location.
Working out the causes of the North+West Europe number (i.e. conversions, or, children of ethnic-intermarriages) would require the ABS to release ‘how many EO selected *only* NE Europe’, etc. At this point, it remains a point of curiosity.
Churches by Ethnic Identification
Written by Fr Andrew Smith
Originally published on 14 July 2022:
https://www.facebook.com/photo?fbid=5192758404179475&set=a.5189970227791626
KEY TAKEAWAYS:
1. Massive growth rates for Middle Eastern Christian faiths.
2. Good growth rates for most Eastern European Christian faiths.
3. Some decline for Ukrainian Christian faiths.
4. Most ethnic faiths are not large (<50k)
5. The increases are correlating with geography, rather than theology.
World turmoil has moved a lot of people.
– Australia resettled a sizeable number of Middle Easterners, and we’re seeing this in the table.
– A caveat: the Census was in 2021. At that point, while Ukraine had conflicts (for some years), the outright war in Ukraine was yet to have its full impact.
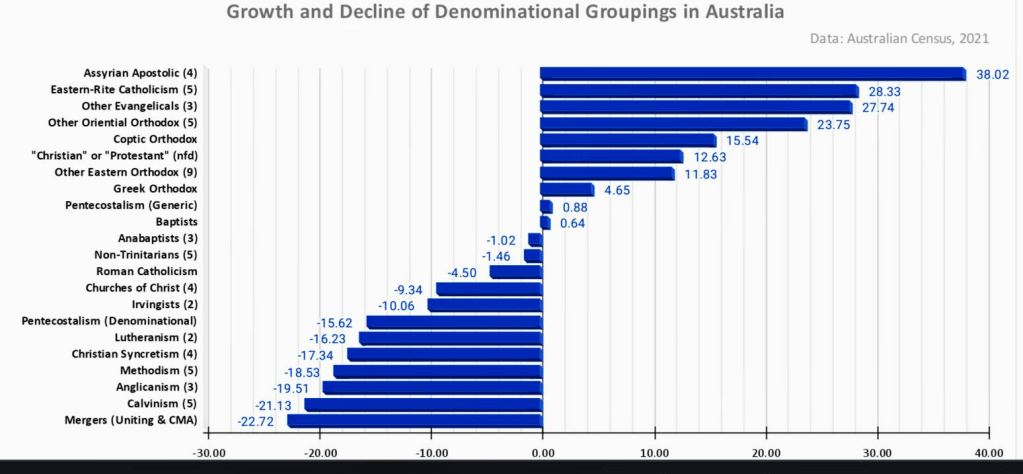
Growth and Decline of Christian Theologies in Australia
Written by Fr Andrew Smith
Originally published on 14 July 2022:
https://www.facebook.com/photo?fbid=5193902640731718&set=a.5189970227791626
There’s been a lot of focus on the decline of Christianity in Australia. For my last post on the Census, I’m looking at whether there is correlation between theology and growth rates.
KEY TAKEAWAYS:
1. Protestant denominational affiliation is in freefall.
TLDR: Ecclesiology matters. If a denomination doesn’t believe that it is the Church, its numbers went down.
2. Protestants are much more inclined to respond more generally (‘Christian’, ‘Protestant’, or even ‘Pentecostal’). This explains a minority of the decline in denominational affiliations.
TLDR: Ecclesiology still matters.
3. The decline of Calvinist denominations indicates to me that sheer stringency of belief is insufficient to prevent disaffiliation.
4. Given age ranges in Australia, I expect that birth/death rates are playing a massive role.
Also, as explained in my previous posts, at least part of the growth rate for a lot of denominations can be explained by immigration. (Just like the Australian population in general).
